David Schmitt · 17 October 2026
Satellite imagery uncovers overlooked mismatches in regional water allocation policies
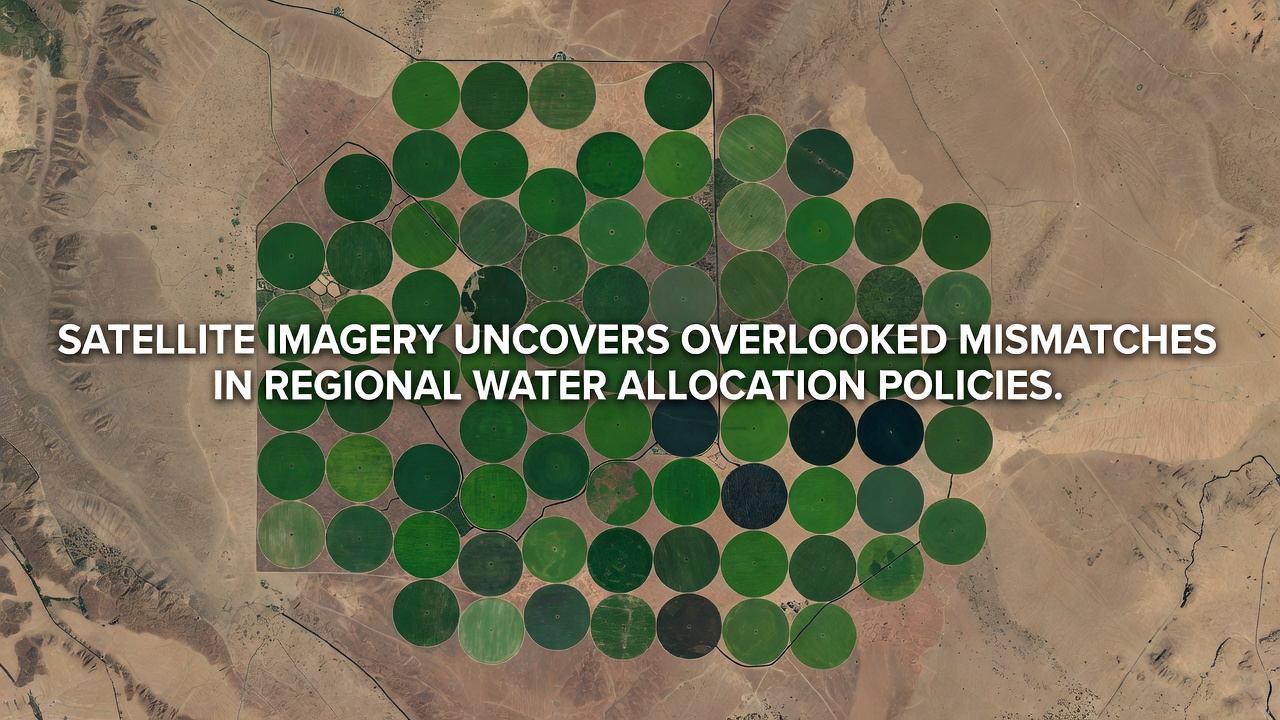
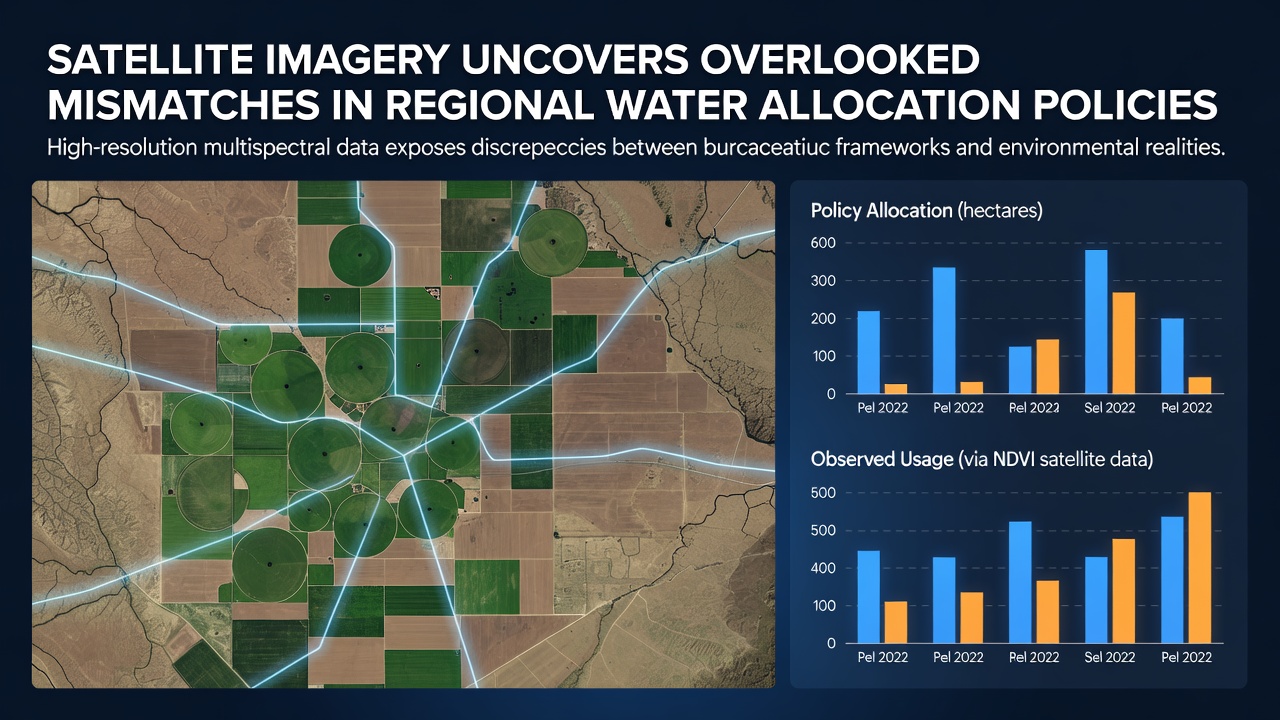
Analysts at space agencies and water research centers have turned to high-resolution satellite data to examine how water gets distributed across river basins and agricultural districts in multiple countries. Data collected through 2026 shows clear discrepancies between official allocation records and actual usage patterns on the ground, with some regions drawing far more than permitted while others receive less than planned.
How satellite monitoring works in practice
Researchers combine multispectral imagery from systems like Landsat and Sentinel with ground measurements to track evapotranspiration rates, reservoir levels, and crop irrigation intensity. These tools allow observers to calculate water consumption over large areas without relying solely on self-reported figures from local authorities. In October 2026 several international teams released updated maps that highlight zones where consumption exceeds licensed volumes by noticeable margins, particularly in areas with intensive farming operations.
One study coordinated across North America and parts of Europe used thermal band readings to estimate crop water stress and actual evapotranspiration during peak growing seasons. Results indicated that certain irrigation districts in the western United States and southern Australia showed sustained overuse signals while downstream communities experienced shortfalls. Government agencies such as the U.S. Geological Survey have made these datasets available for further analysis through their Earth Resources Observation and Science Center.
Regional examples of policy mismatches
Across the Murray-Darling Basin in Australia, satellite-derived estimates aligned with on-site audits to reveal that some upstream license holders extracted volumes exceeding caps during dry periods, while downstream environmental flows fell short of targets set in basin plans. Similar patterns appeared in parts of the Colorado River system where imagery captured expanded field coverage beyond what allocation ledgers recorded. European observers noted comparable issues along sections of the Danube where agricultural withdrawals outpaced declared amounts in several member states.
These findings emerged because satellites capture continuous data regardless of administrative boundaries, allowing cross-border comparisons that traditional reporting often misses. A separate analysis linked to the European Environment Agency documented shifts in water body extents and vegetation health that pointed to uneven enforcement of existing directives. The data does not assign intent but documents measurable differences between planned distribution and observed reality.
Policy frameworks and data integration challenges
Water allocation policies typically rest on historical usage rights, environmental flow requirements, and population projections. Yet many of these frameworks originated before routine satellite monitoring became widely accessible. When newer imagery gets layered onto older records, mismatches surface in both volume and timing of withdrawals. Agencies in Canada and the United States have begun pilot programs that feed satellite indicators directly into compliance dashboards, though full integration remains uneven across jurisdictions.
Observers note that seasonal variability adds complexity. Drought years amplify visible gaps while wet periods can mask them. Researchers at academic institutions have published methods for adjusting imagery for cloud cover and sensor drift, producing more reliable long-term trends. These adjustments help distinguish temporary anomalies from persistent policy shortfalls that span multiple years.
Next steps for agencies and stakeholders
Authorities responsible for basin management now face the task of reconciling satellite evidence with existing legal instruments. Some districts have started voluntary reporting enhancements that include imagery verification, while others await updated regulations. International bodies such as the World Meteorological Organization have hosted workshops to standardize methods for converting raw satellite readings into policy-relevant metrics. Progress depends on continued data sharing among nations that share river systems.
Conclusion
Satellite monitoring continues to supply independent measurements that complement traditional water accounting. The patterns documented through late 2026 illustrate where current allocation rules and actual consumption diverge, giving planners additional information for future adjustments. As more agencies incorporate these tools, regional policies may evolve to reflect the spatial and temporal realities captured from orbit rather than relying only on ground reports.